
Crypto Volatility #8: Magnum Opus
Intro into @crypto_volX Magnum Opus

This part is all about Magnum Opus.
These are not predictions. These charts are about where we are in between tops & bottoms or accumulation periods & blow-offs. The @crypto_volX index is indifferent to any price action or exchanges volumes.
The best description is - where we are in crypto depression & mania - crypto accumulation or blow-offs. Therefore the charts are most useful at peak fear - the peak depression or peak optimism - the peak mania.
Magnum Opus includes three parts:
Global View - where we are in the long term (4+ years).
Local View - where we are in the shorter term (6 to 18 months).
Experiments - these charts will make sense once battle tested and require more time to develop. Some are very interesting!
THE GLOBAL VIEW
A few charts to tell us how far are we from 2017 peak. As You’ll see - very, very far from it.
01
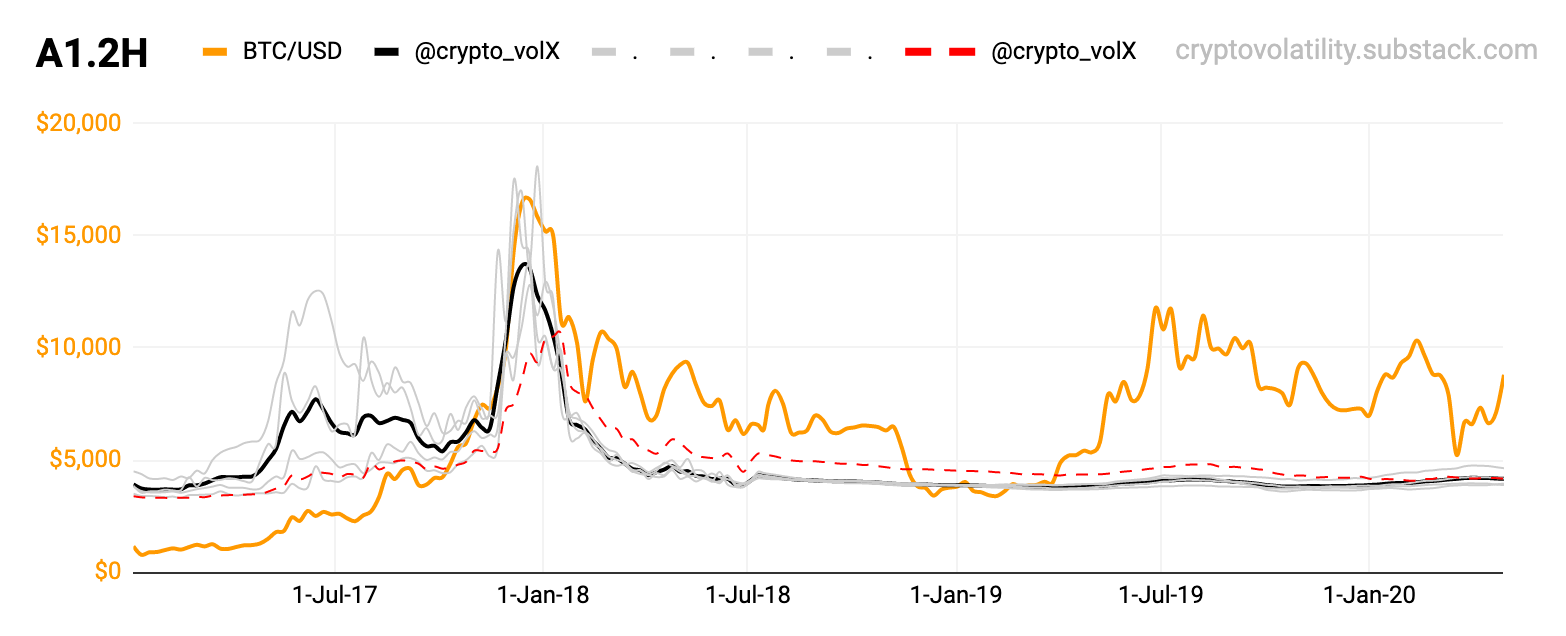
A1.2H No global peak in sight, all good. The rest is accumulation. Also notice the grey & the red in Q4/2017 in conjunction with price action..
02
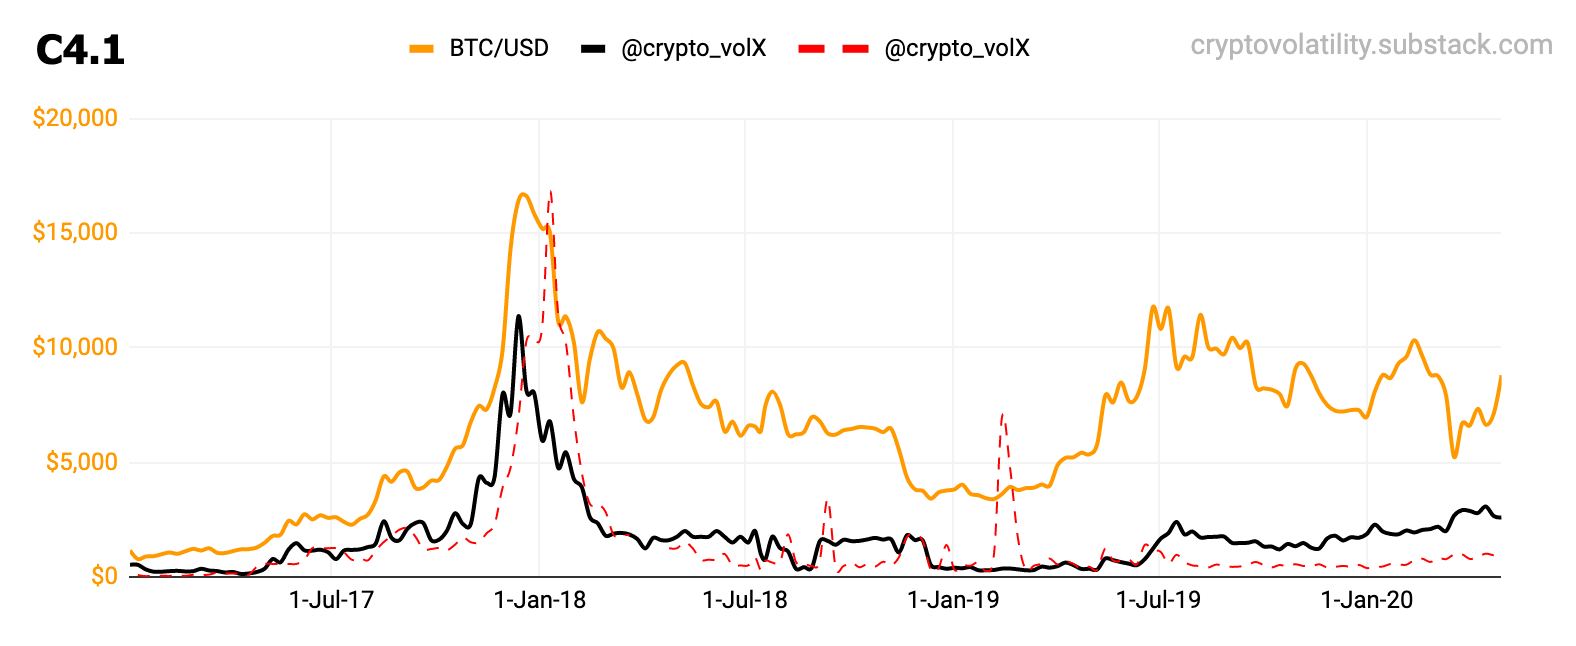
C4.1 Same here, no problem. However it will be interesting to watch in next 6-18 months. The black & red in 2017 was a great trigger for getting out.
03
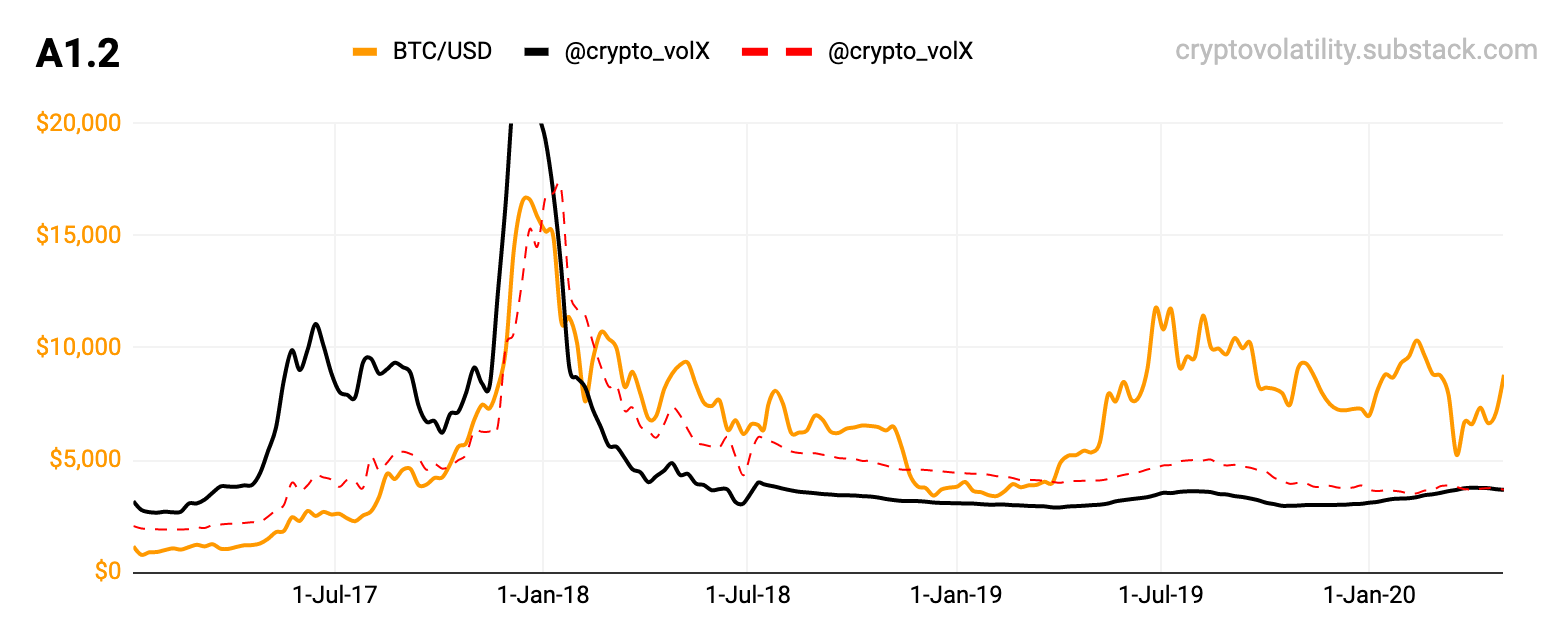
A1.2 This is how it looks like when market goes nuts in Q4/2017. Nothing to see here but accumulation in 2019.
04
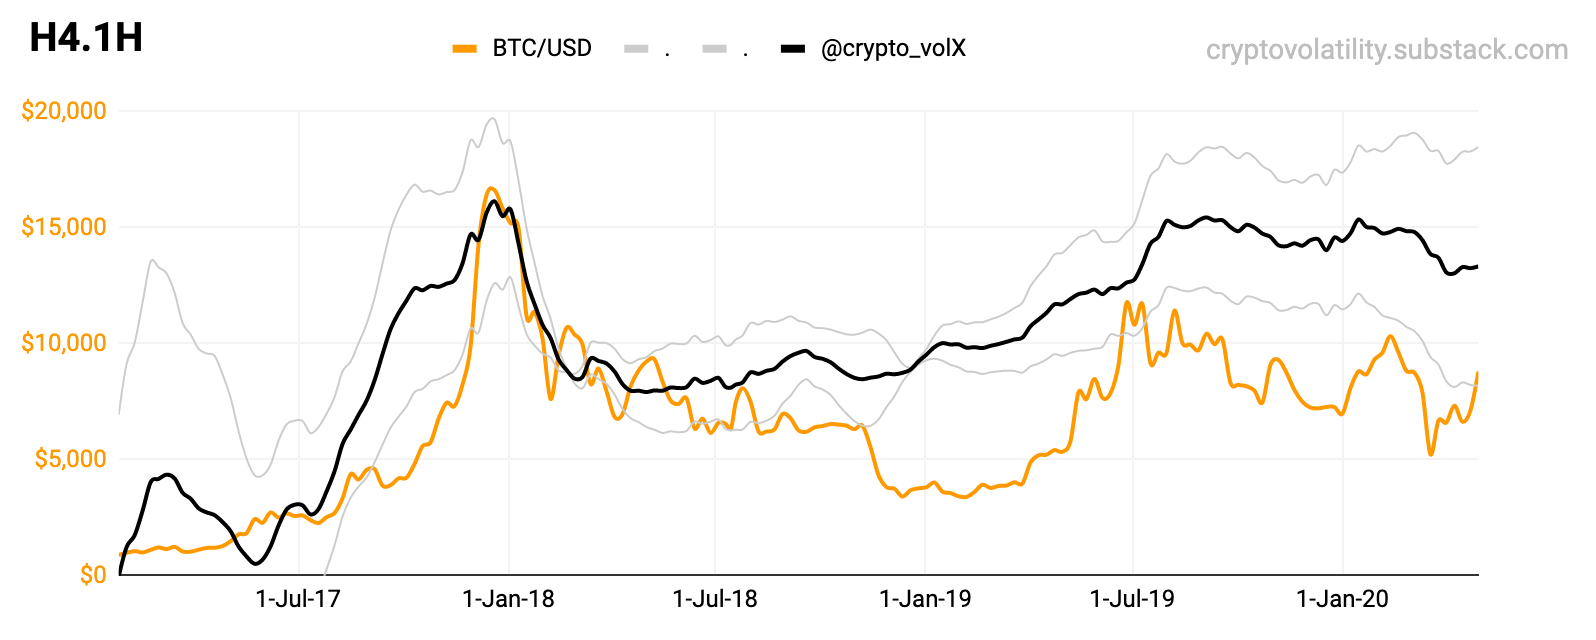
H4.1H Nice leading signal in 2017. The @crypto_volX needs to go up & up - no other way in the long term. If it stalls - there is some problem with the market. Either locking gains or - exhaustion & prepping for take off.
05
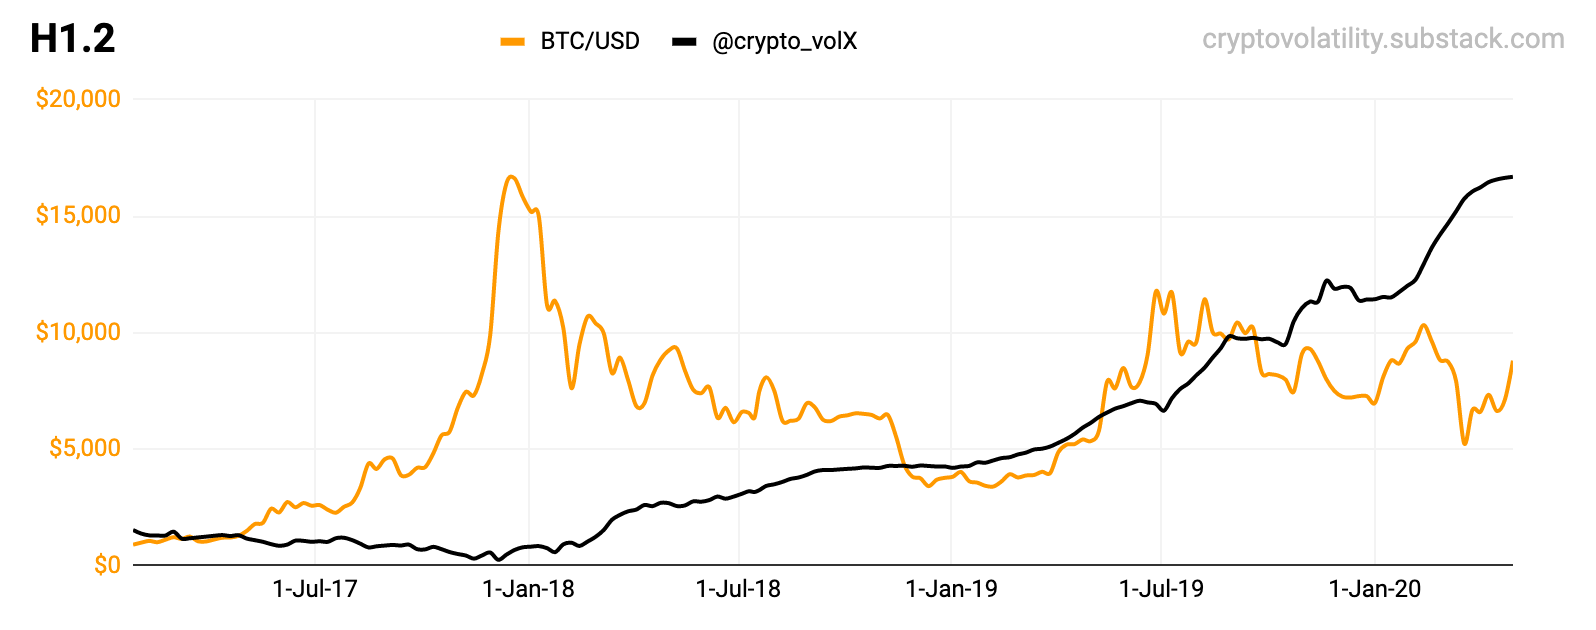
H1.2 Same here, the only way is up - in the long term. The whole 2018 is interesting as it just grew slowly (accumulation). Fast rise means a potential for blow off (Q3/2019 & Q1/2020). You can look back at this one in 6-12-24 months - it will be going up long term. Until the global peak (see Q4/2017).
06
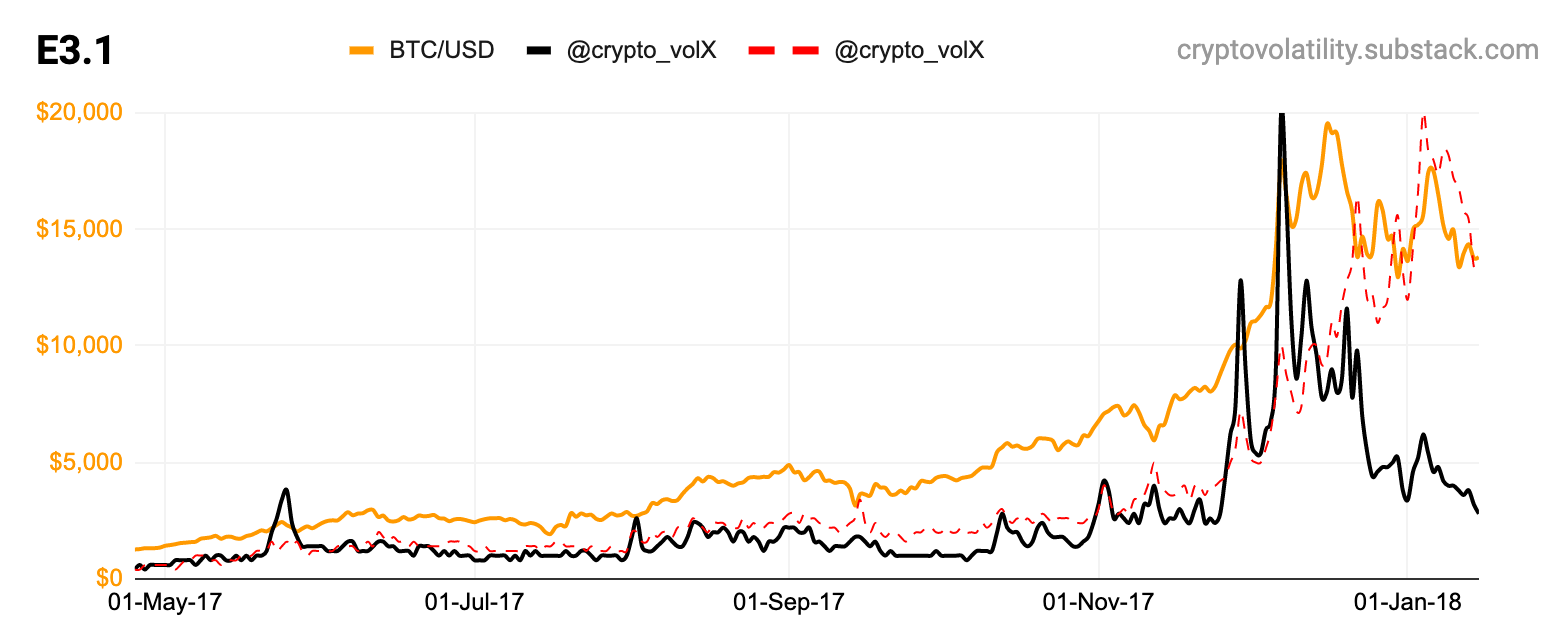
E3.1 All in all - there is now no need for this kind of charts in 2020 as it all too early - we are very far from the Global peak. This is very detailed one, under the hood - to really time the Global Peak. It’s been all slow accumulation (Q1/2019 & Q4/2019) & eventual blow-offs (Q3/2019). Plus the macro bomb, the virus.
THE LOCAL VIEW
These charts are about - if there is anything from past that applies to future possibilities. Quite interesting!
01
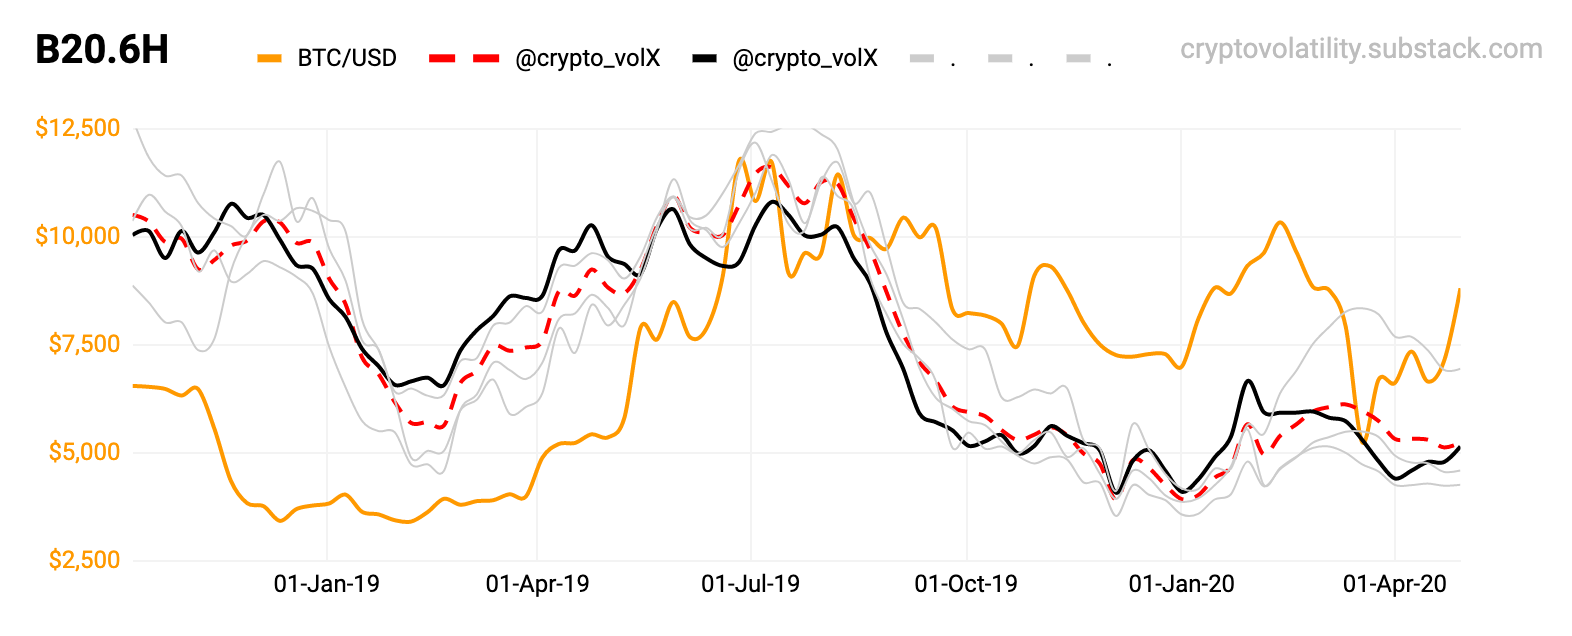
B20.6H See how the @crypto_volX (black) leads in Q1/2019 and starts to top or stall in Q2 - reaching a triple peak before the July 2019. Also see the widespread bottom forming at the end of 2019 - nice accumulation period. Not being for the macro bomb aka the virus..
02
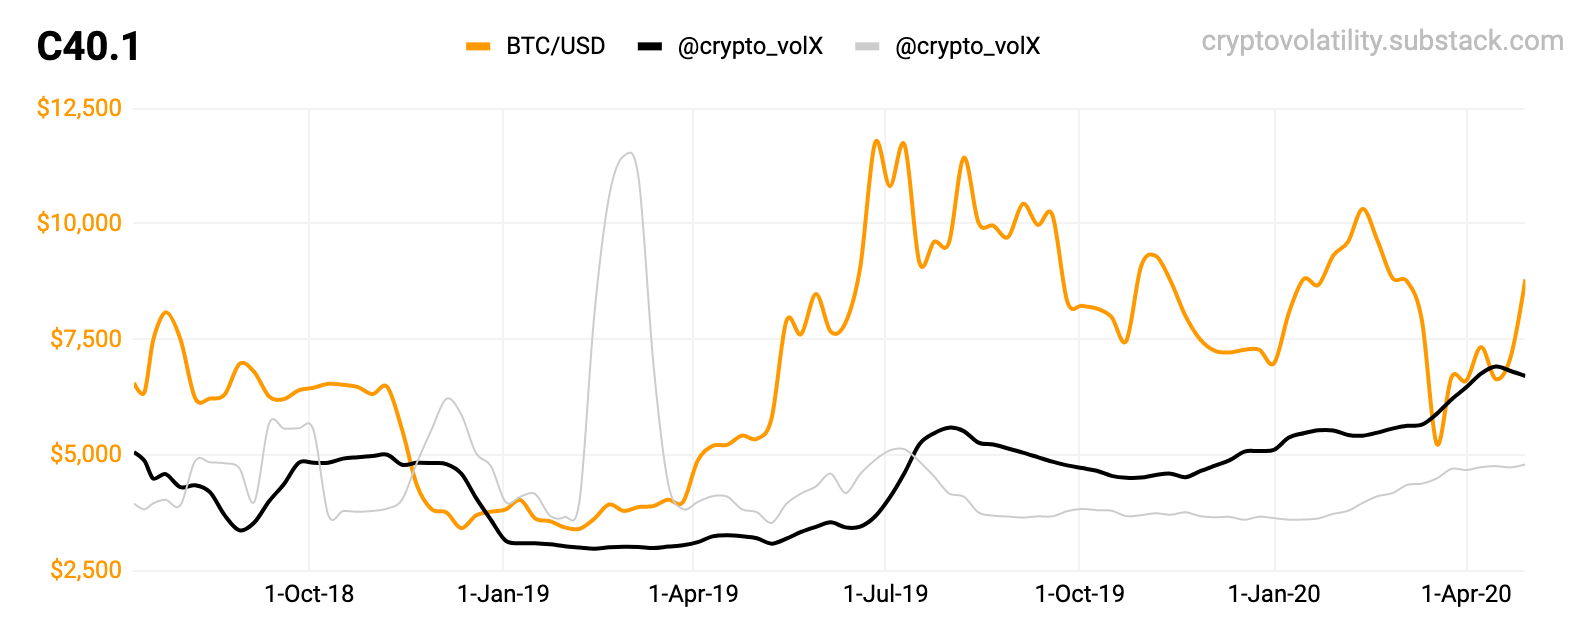
C40.1 The grey @crypto_volX went like a grenade in mid-February 2019 during the bottom. However all eyes are on the black one here!
03
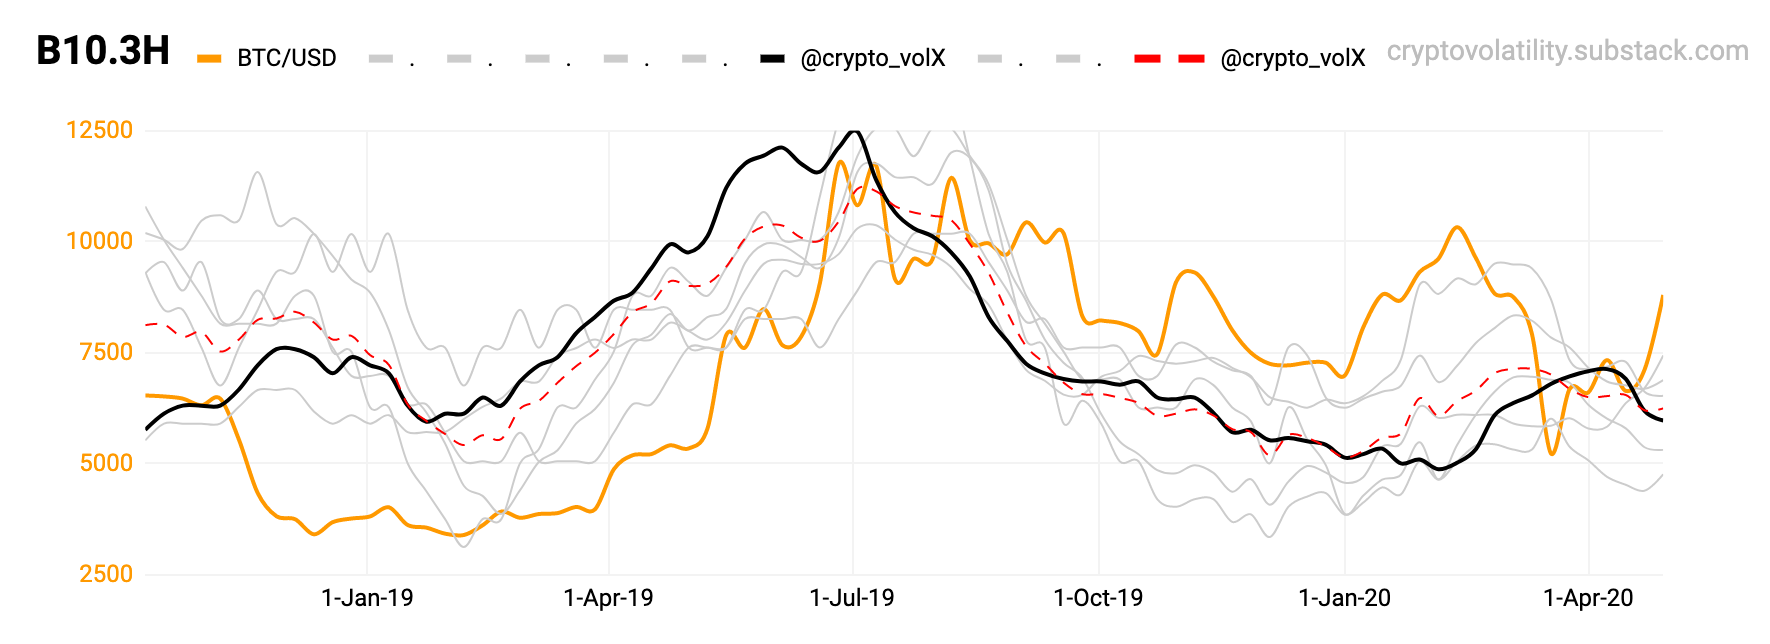
B10.3H The early start in 2019 (January) was a great leading indicator! That also confirmed with the top in June/July 2019. See the grey “hair“ forming a nice bottom in Q4/2019. Dust will settle for 2020, just wait & see.
04
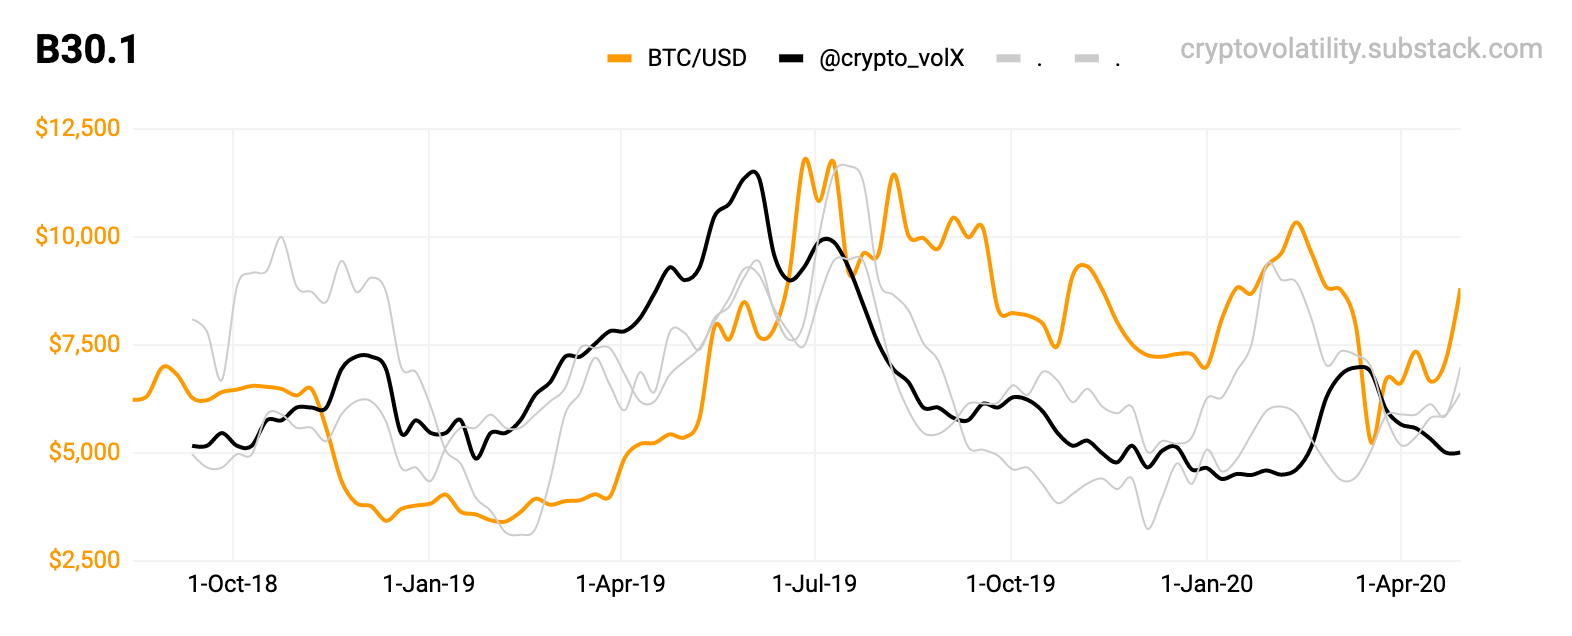
B30.1 Again, same @crypto_volX indicator leading with grey ones lagging nicely. It was a clear signal to get out - in between those two. The bottom in Q4/2019 could not have been wider..
05
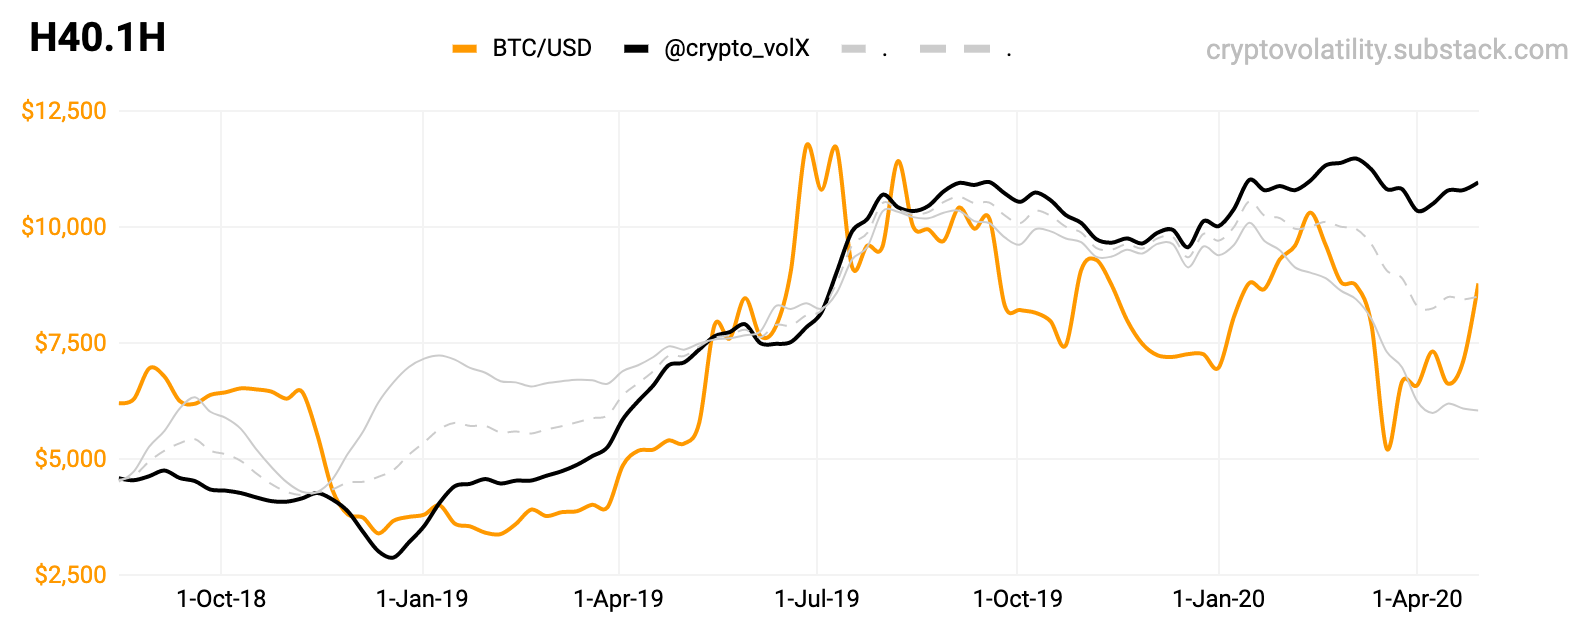
H40.1H The accumulation hits off right in January 2019 and the indicators shows a clear sign of taking profits at the peak (@crypto_volX stalls for months afterwards). The next stage is up. There is only one way the indicator can go long term - and that is up. Stalling means taking profits.
06.A
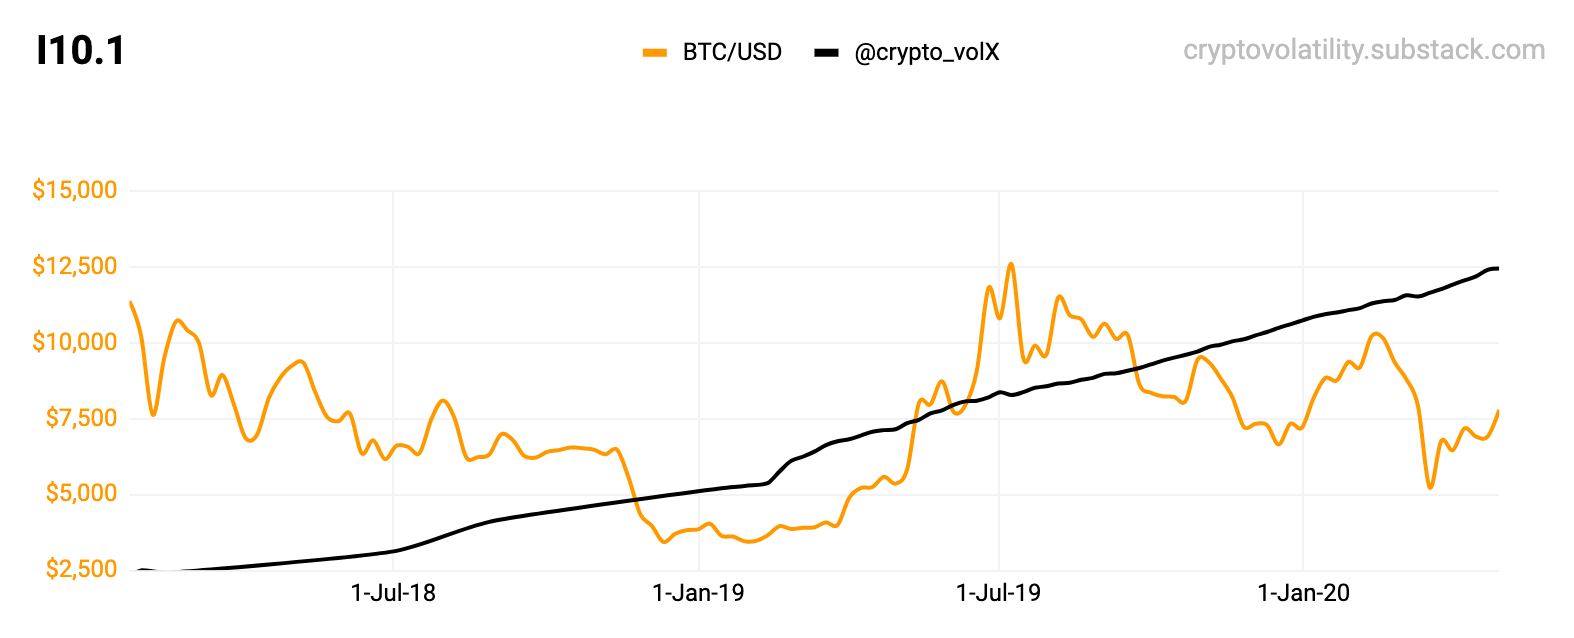
I10.1 This one is interesting. There is only one signal for this @crypto_volX: Sharp rise (mid-February 2019) presses the price action upwards. There is no other thing to see on this chart. See below for 4 years view for further explanation.
06.B
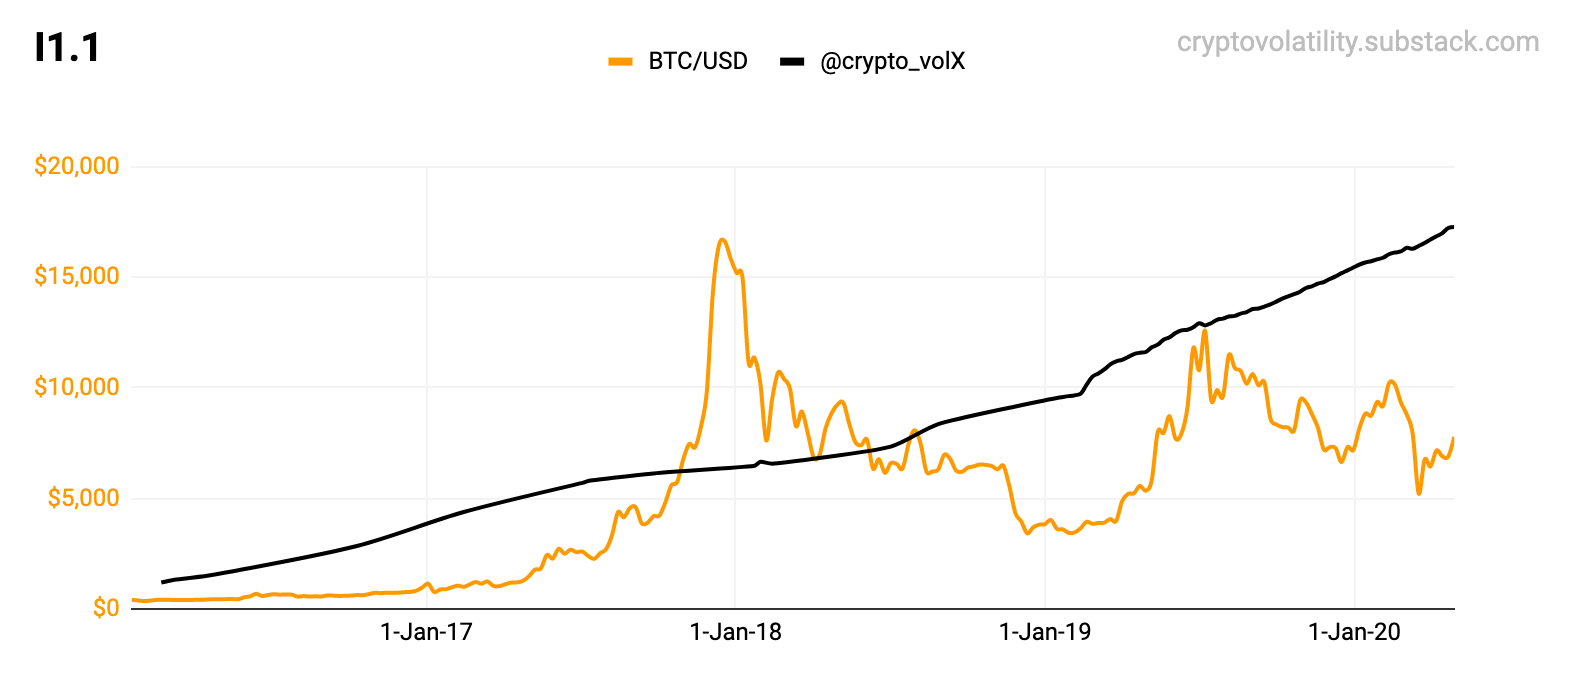
I1.1 As the previous chart showed - there is only one single thing to watch (a sharp rise). On this chart - during the “Q4/2017 peak“ - the opposite happens - the @crypto_volX indicator goes flat. This is the only thing to watch during the global peak or peak mania. The flatlining of @crypto_volX on this one.
07
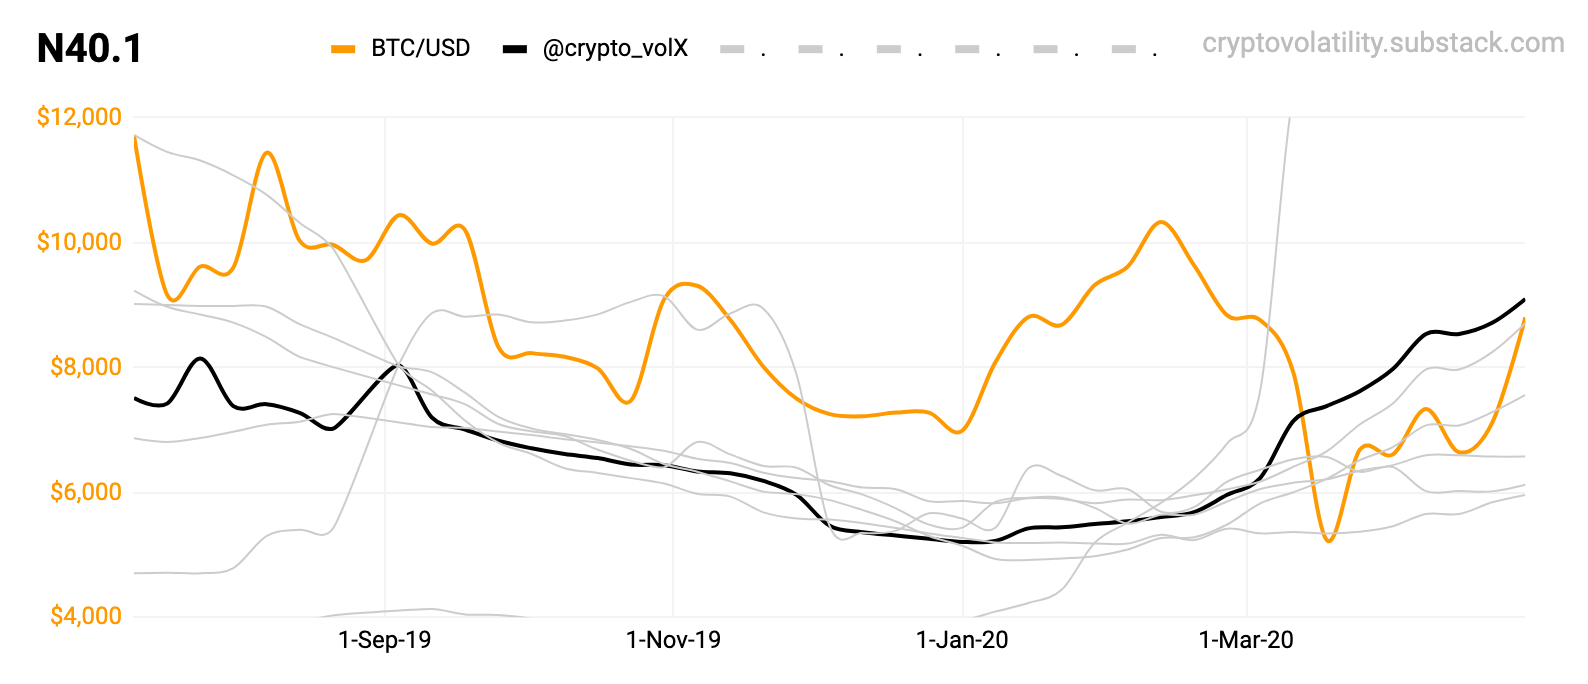
N40.1 This is very simple - @crypto_volX looking for bottom formation & confirmation (Q4 2019).
#CryptoNote (will come back to it later).
THE EXPERIMENTS
These charts are experiments & will require additional time and to be really battle tested. Some of them developing quite nicely!
01
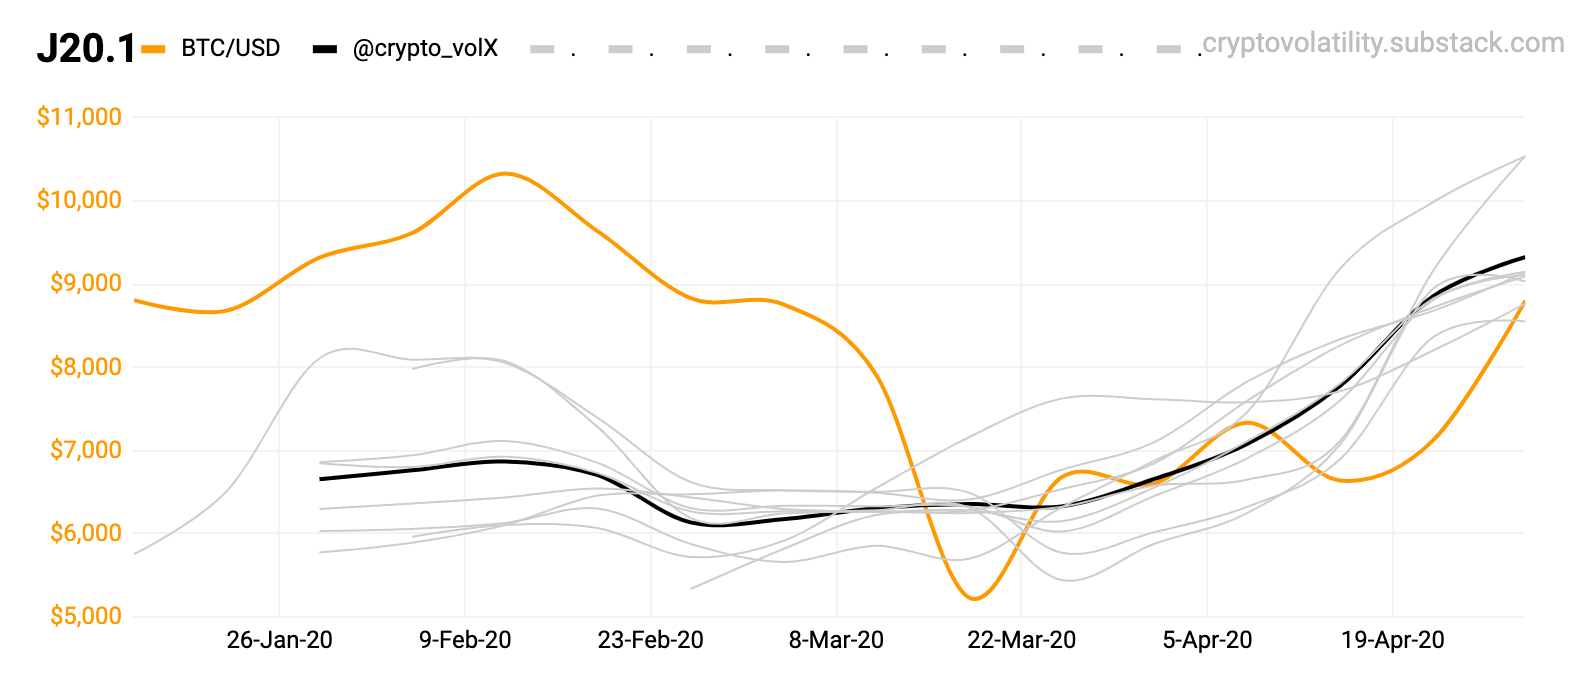
J20.1 Watch the grey ones..
02
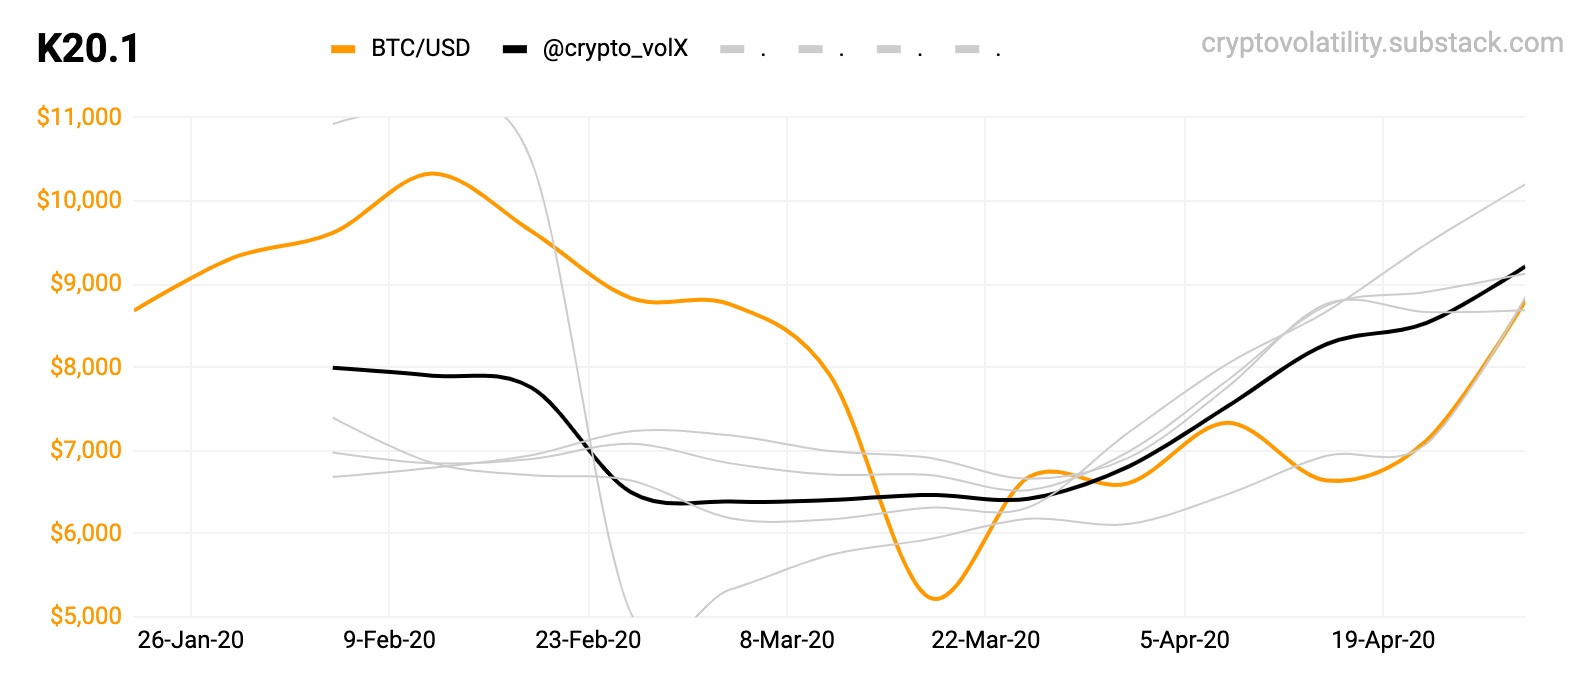
K20.1 Again, watch the grey ones..
03
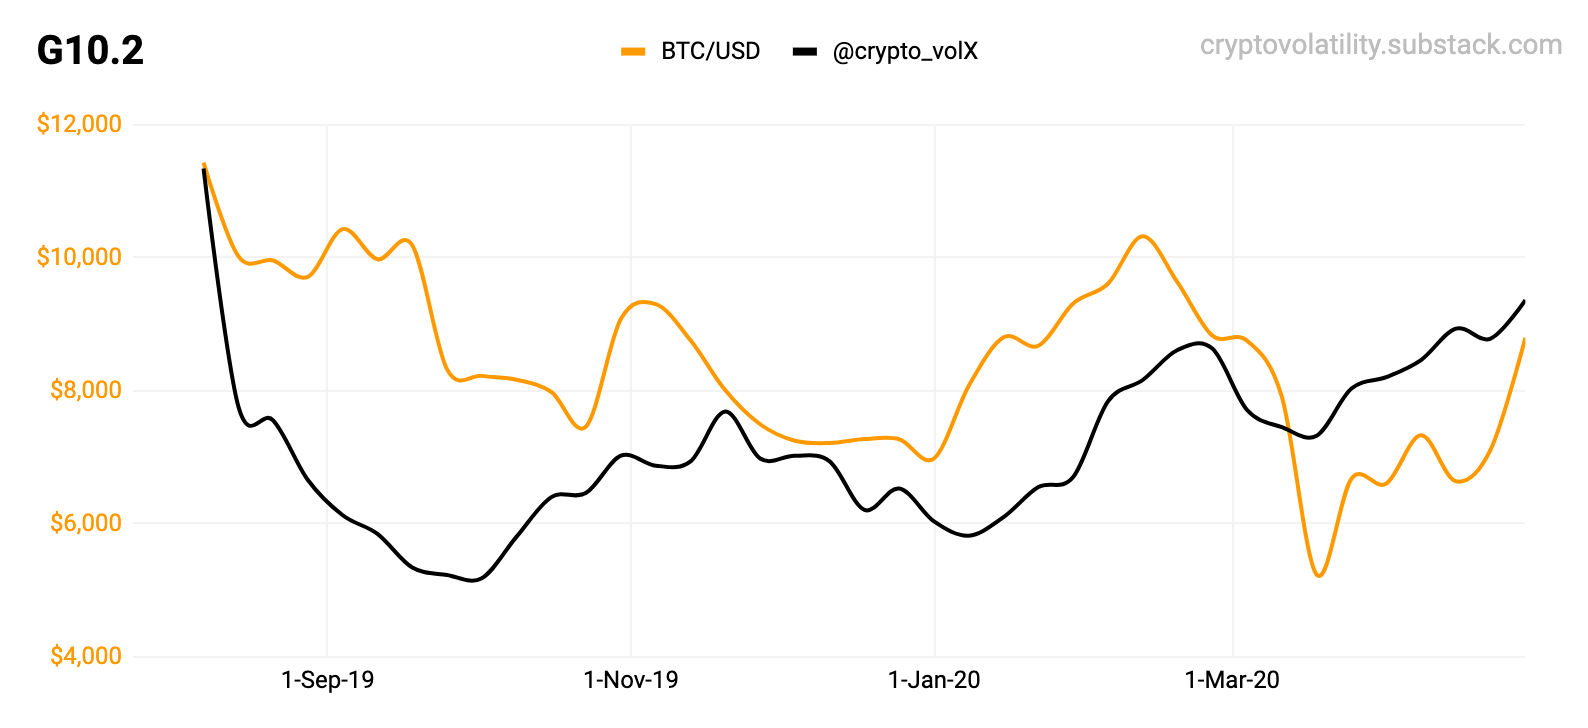
G10.2 Nicely developing pattern of bottom to slow rise.
#CryptoNote (will come back to this later).
04
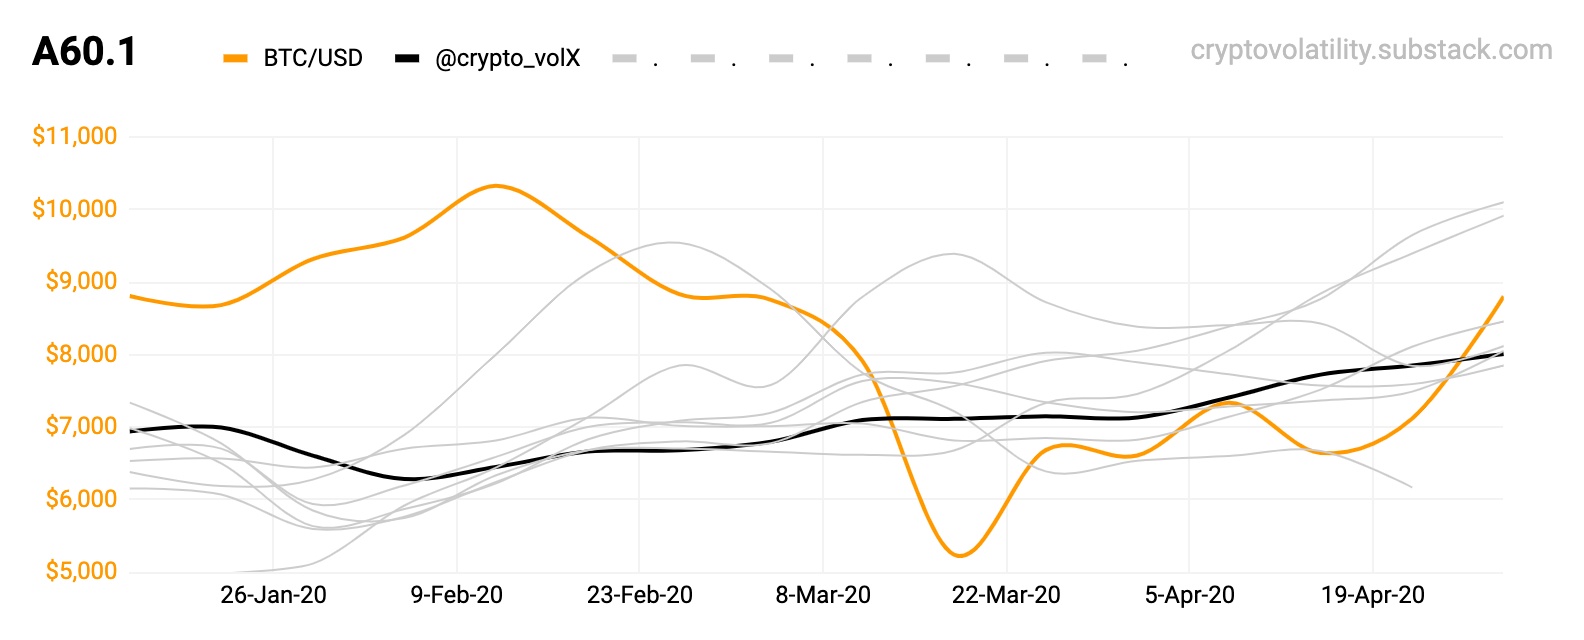
A60.1 Again, watch the grey ones..
05
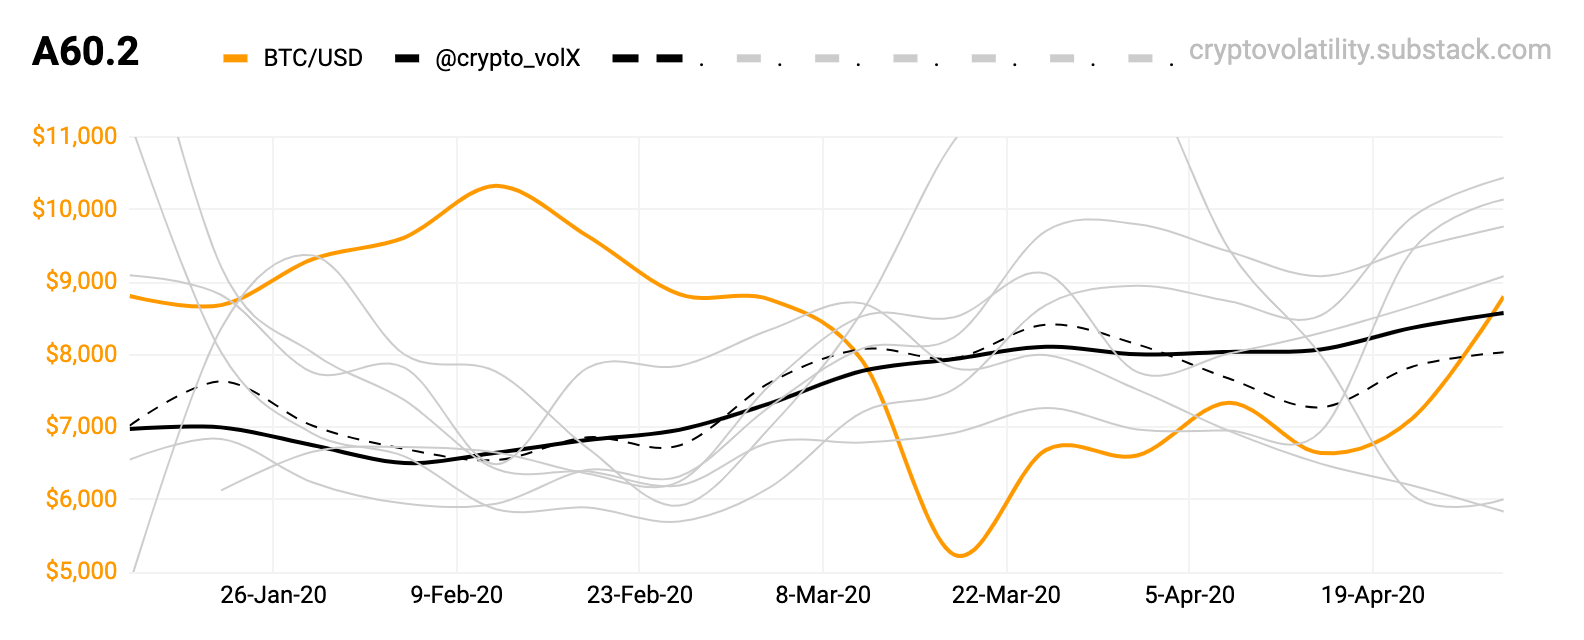
A60.2 Again, watch the grey ones..
06
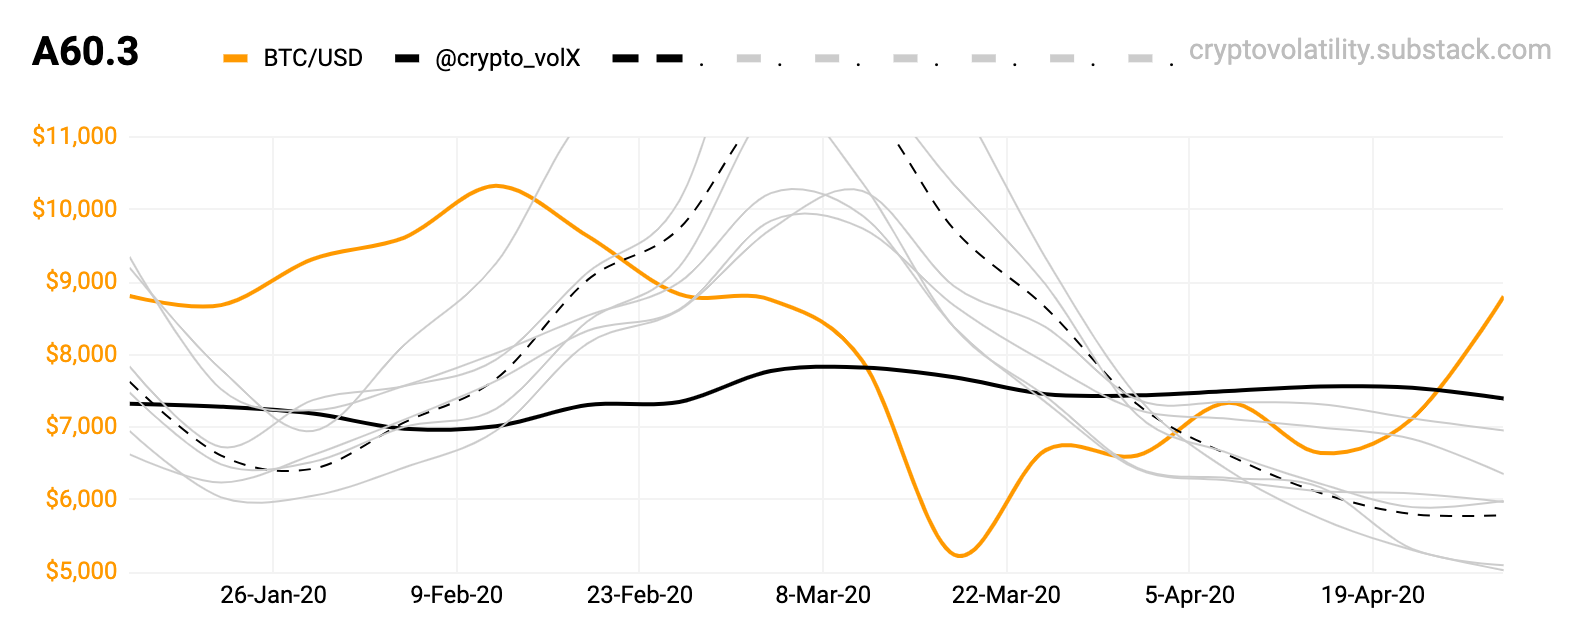
A60.3 This one will be interesting after both - the global macro bomb settles and volatility decreases.
07
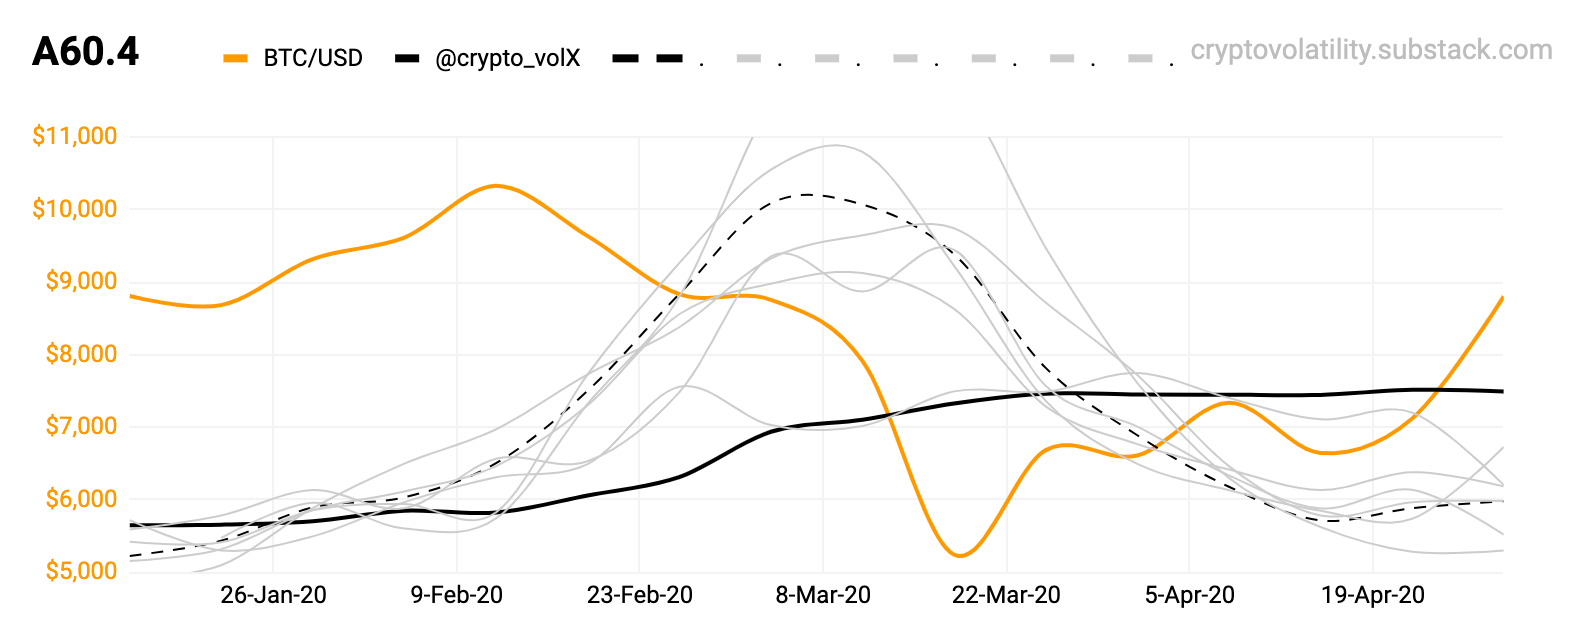
A60.4 The macro bomb. Watch what the bottom does going forward..
Here are some older posts:
#5 Other Charts.
#4 2013 - 2014.
#3 Global Tops.
#2 Local Bottoms.
That’s for today; enjoy, share or comment! Stay safe.