
Crypto Volatility #9: Daily Edition
Intro into @crypto_volX Daily Edition

This part is all about Daily Addition.
If you want to see the previous long post with 20+ charts see - “#8 Magnum Opus”.
These are not predictions. These charts are about where we are in between tops & bottoms or accumulation periods & blow-offs. The @crypto_volX index is indifferent to any price action or exchanges volumes. This charts are not for short term trades!
The best description is - where we are in crypto depression & mania - crypto accumulation or blow-offs. Therefore the charts are most useful at peak fear - the peak depression or peak optimism - the peak mania.
The Daily Addition Includes:
Microscopic View I - what is is going on exactly today and recent days - drilled down to a day.
Microscopic View II - what is going on exactly today despite the chart is not daily as the focus is long term trends.
This part will be developing and will never be free later on. These are very crucial for directions in blow-off or take off possibilities and probabilities.
CHARTS
Microscopic View I
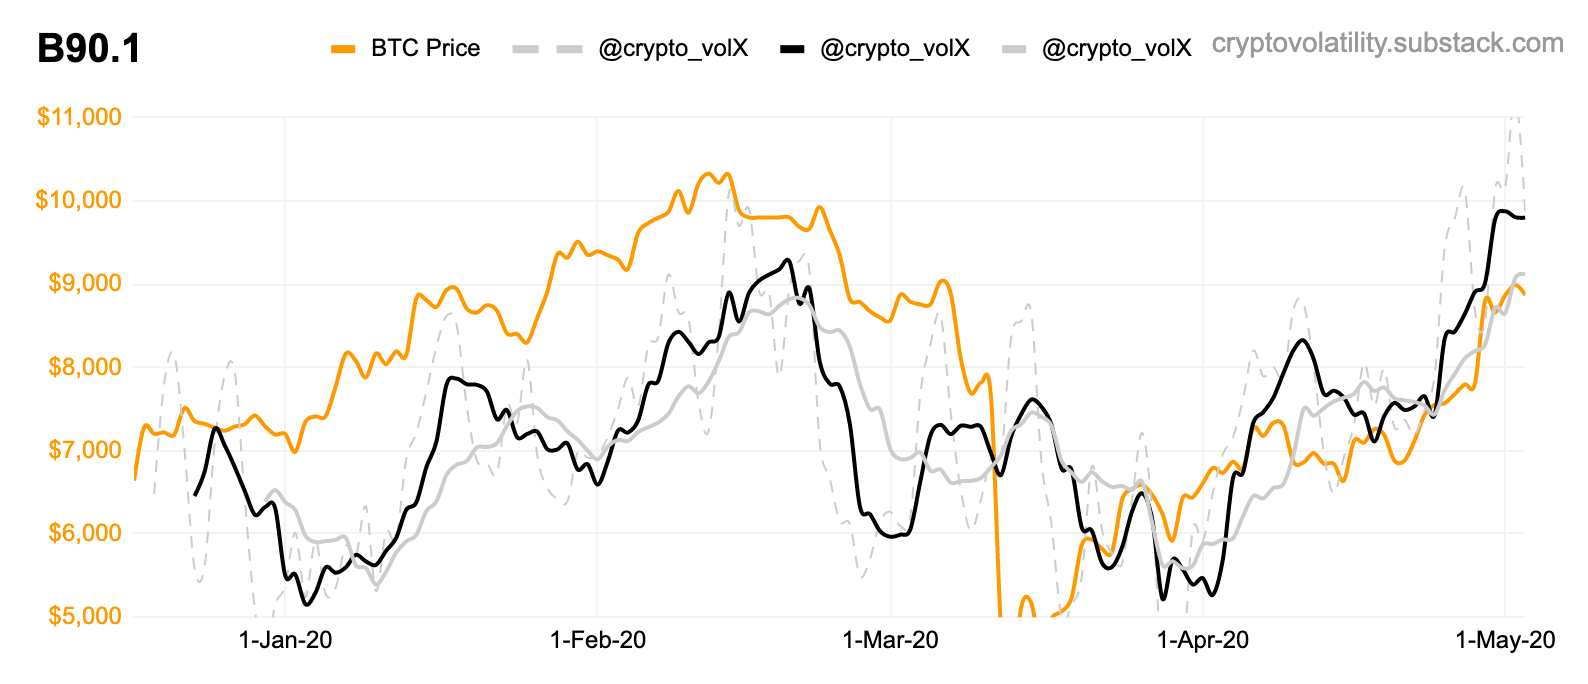
B90.1 This one is cleaner than the one below. The bottom are very nice, also the blow-offs.
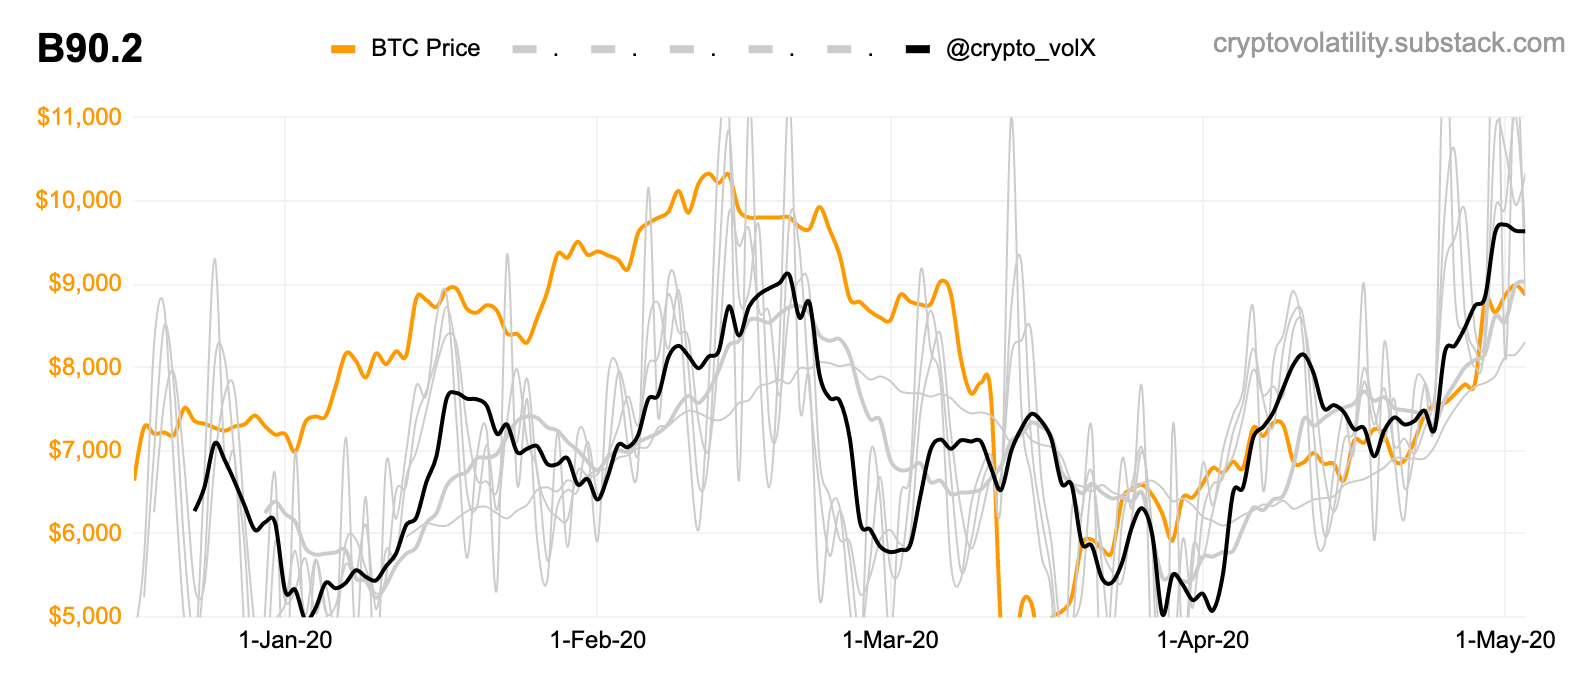
B90.2 Same chart, much “dirtier“ however gives you more direction and sense long term.
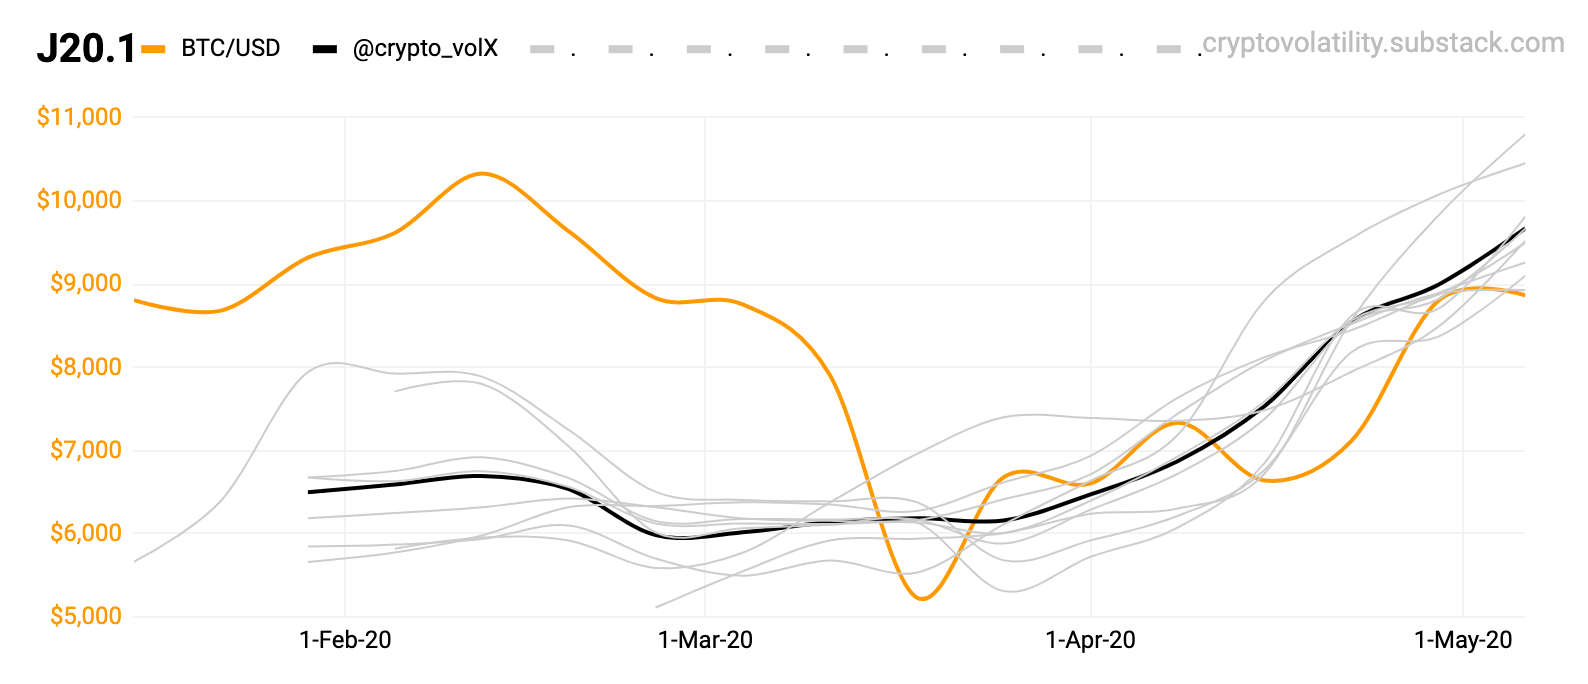
J20.1 This one works well with both previous two and will be very key to watch for shifts.
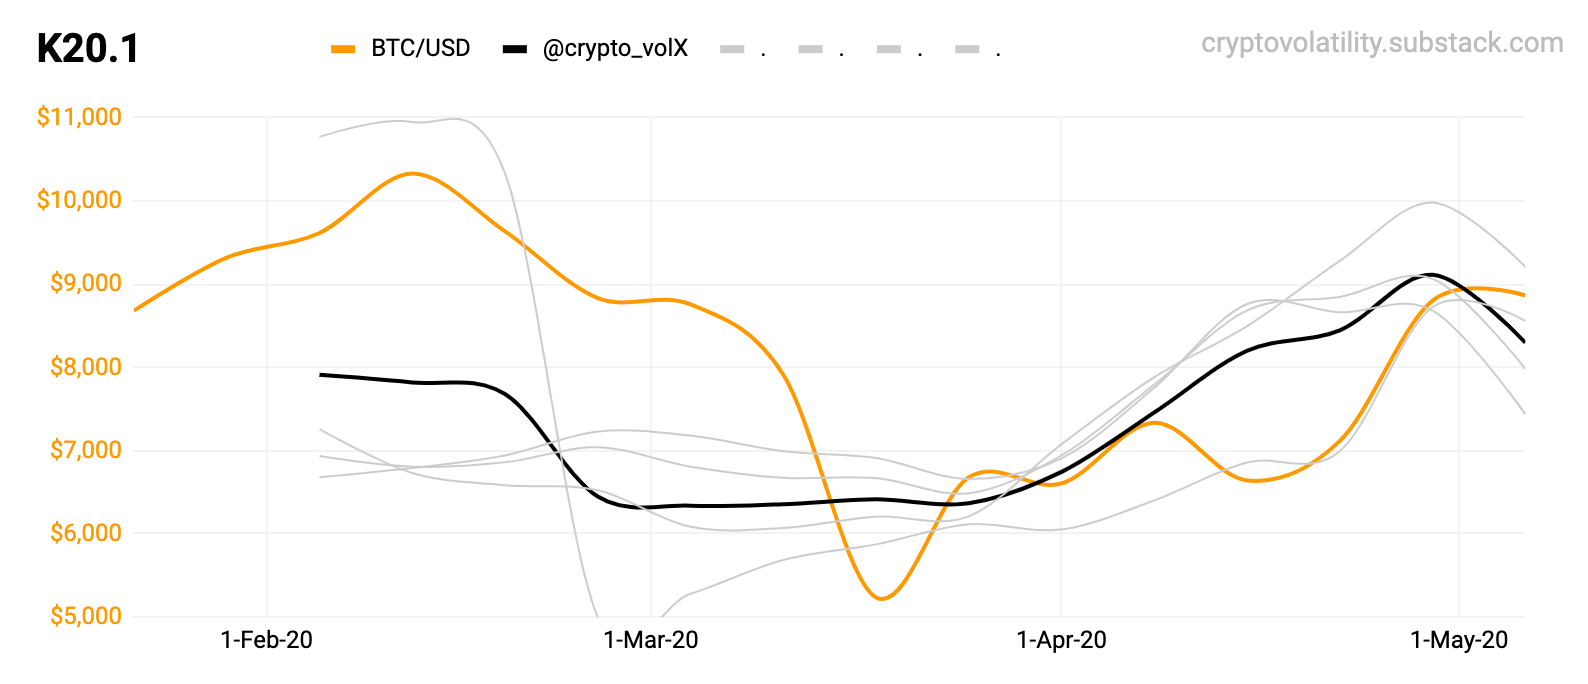
K20.1 Little bit worrying one - however - the importance - is too low at the moment. Wait 6-12 months.
Microscopic View II
Now the first one (A50.10) shows the long term trends and is very connected to the 4 following charts. Why?
The first two below the A50.10 (A60.1 & A60.2) are leading in bull.
The last two below them (A60.3 & A60.4) are lagging in bull.
Therefore if there is short or long term top - first two are topping out, while the other two are still rising from & squeezing final juice.
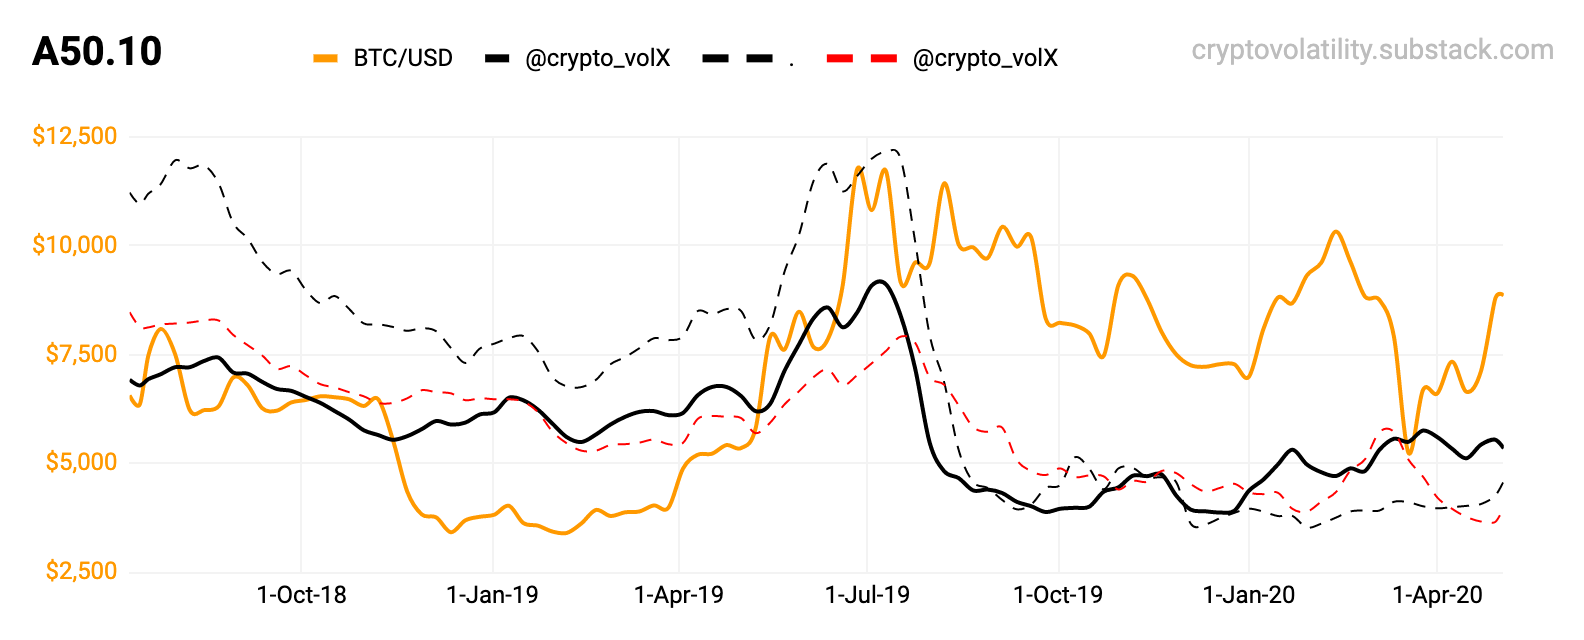
A50.10 Blow-off: Notice the black ones vs red one in July 2019. Also see the bottoms forming in Q1 2019 and Q4/2019.
Watch the gray leading lines on all four charts below.
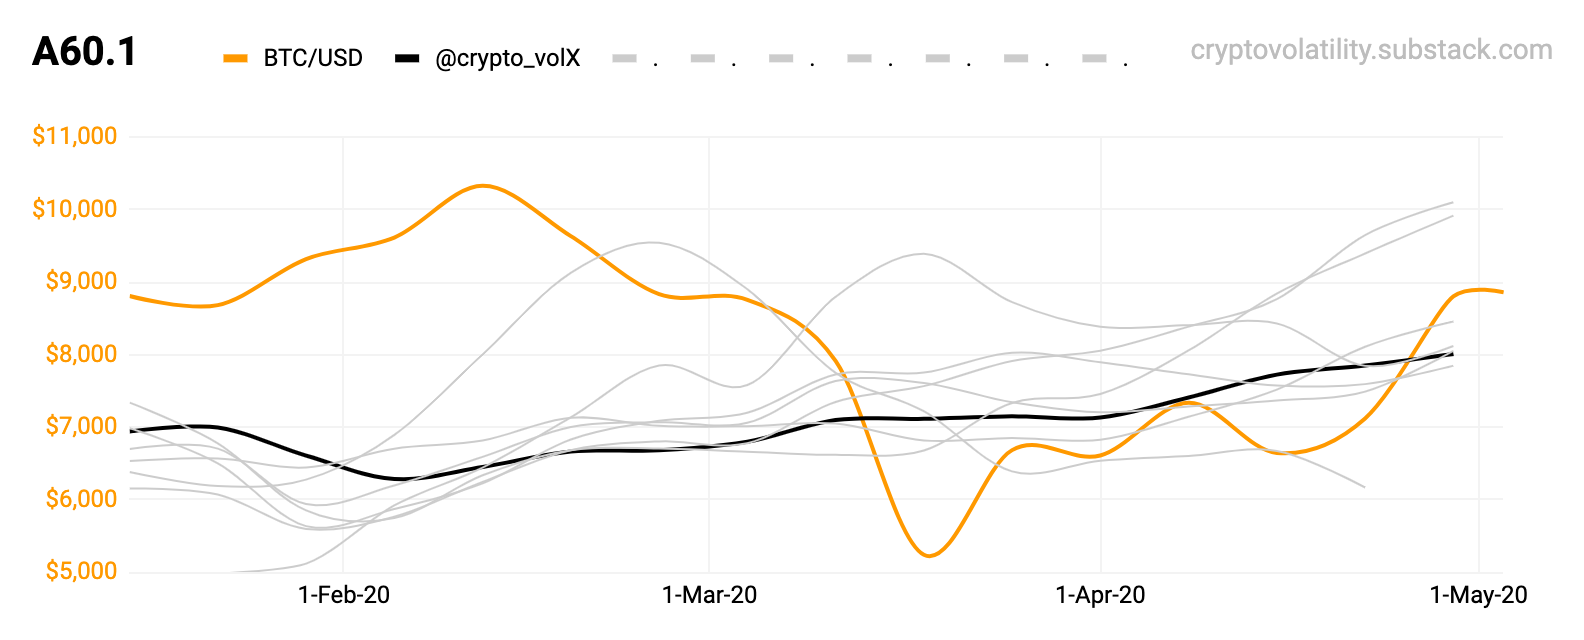
A60.1 Leading one from these four charts - watch the gray.
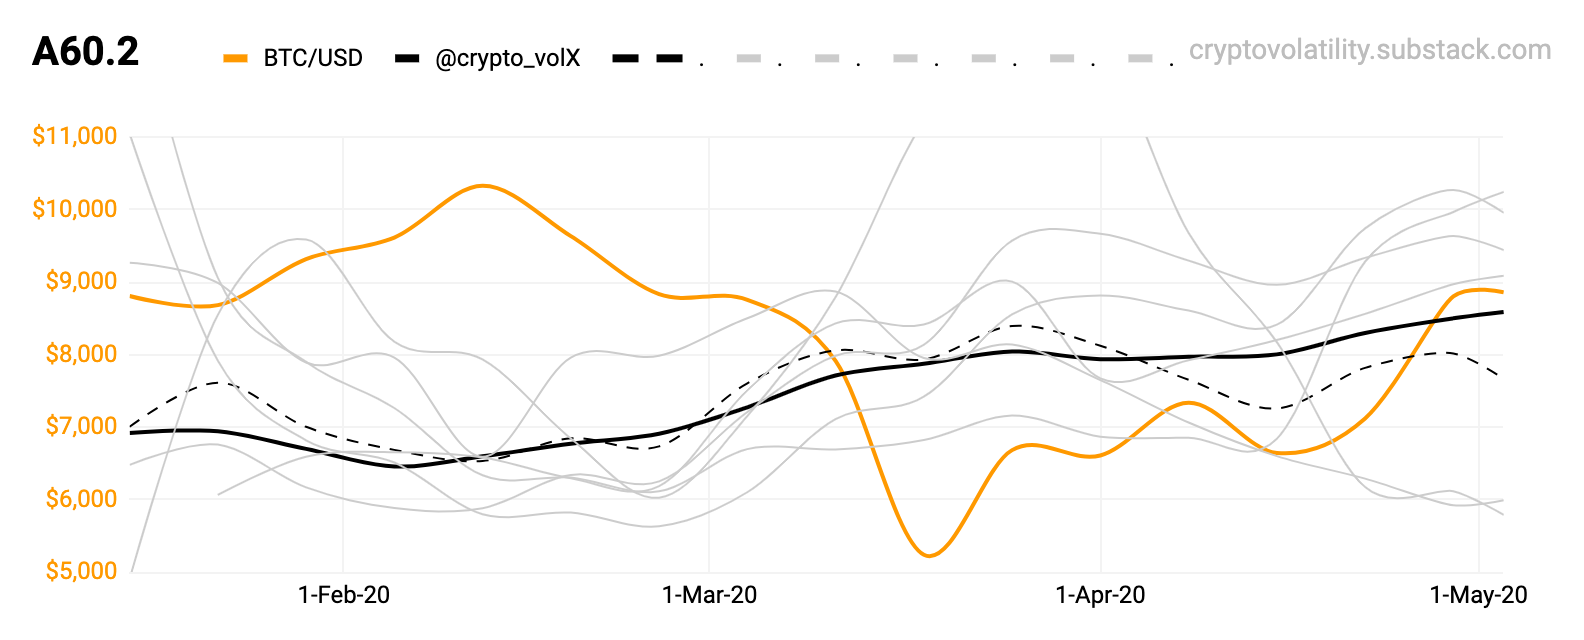
A60.2 Second leading one from these four charts - watch the gray.
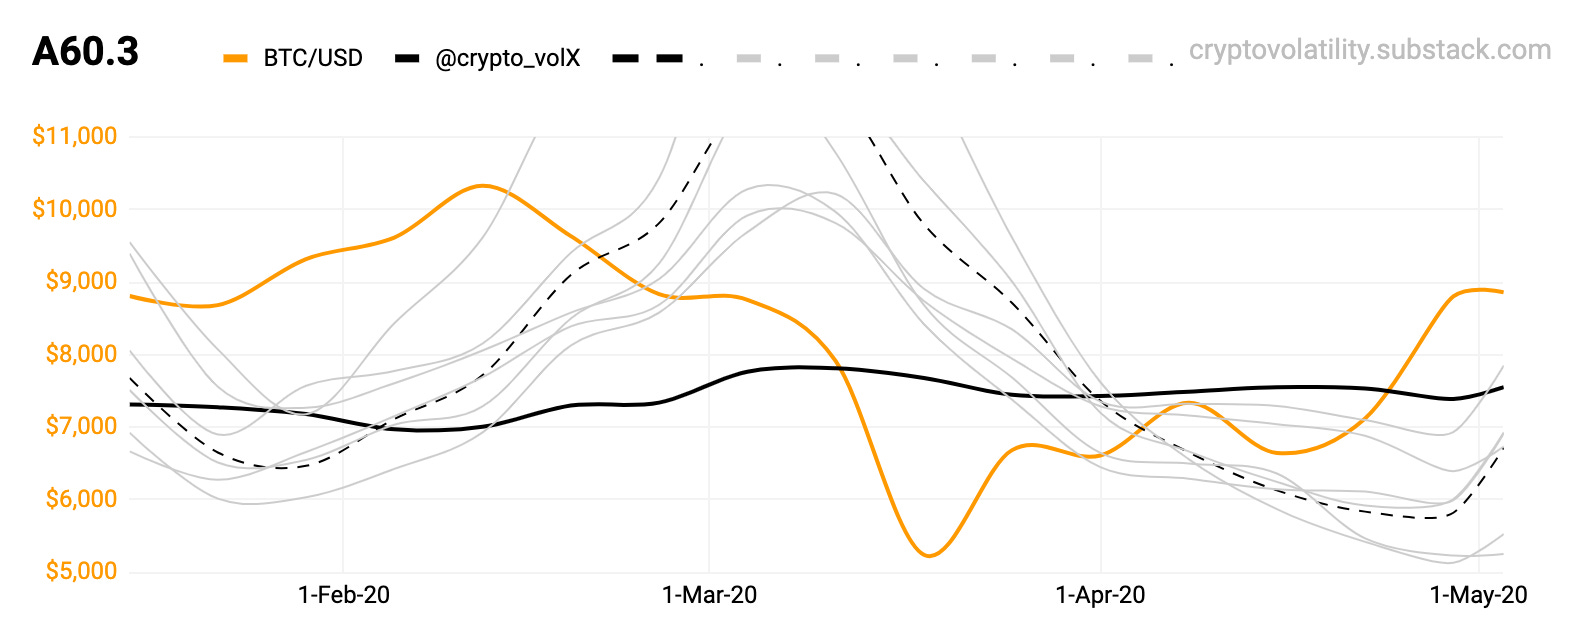
A60.3 Lagging one from these four - see also the lag last week? Now imagine 6-18 month timeframe.
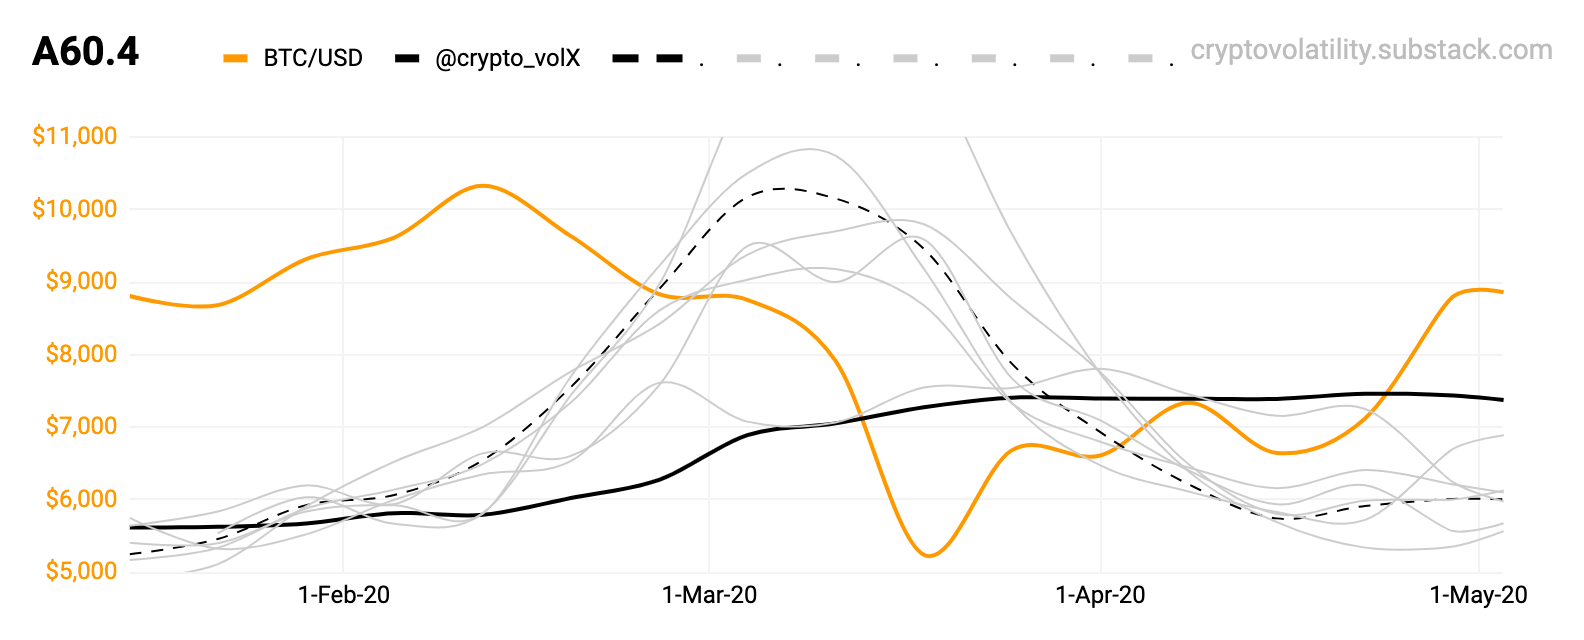
A60.4 Lagging one from these four - nicely stalling and prepping for eventual take-off.
Both four can be improved - so will try to do so ;-)
Here are some older posts:
#8 Magnum Opus.
#5 Other Charts.
#4 2013 - 2014.
#3 Global Tops.
#2 Local Bottoms.
That’s for today; enjoy, share or comment! Stay safe.